Most retail traders learn candlestick patterns from a chart that shows a “Hammer” at a market bottom with a green arrow pointing up and the word “BUY.” They memorize the pattern, see it on a live chart, enter a position, and lose money. They then conclude that technical analysis does not work.
Technical analysis works. The problem is that candlestick patterns are not signals. They are forensic evidence. A candlestick tells you what happened during a specific time period — where the price opened, how far buyers pushed it up, how far sellers pushed it down, and where it closed. Reading a candlestick is reading a battle report between buyers and sellers. Acting on that report without understanding the terrain where the battle occurred is what produces losses.
This article explains how to read candlesticks as institutional traders read them: not as isolated patterns triggering automatic actions, but as contextual information that gains meaning only when combined with market structure, volume, and price location.
—
The Anatomy: What a Candlestick Actually Represents
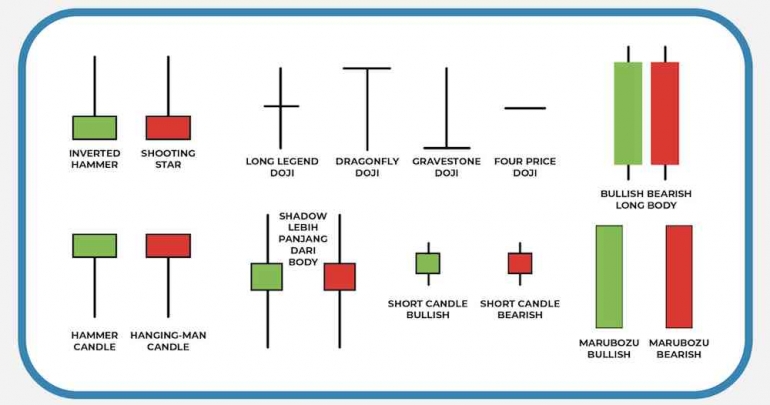
A candlestick has four data points: open, high, low, and close. These produce three visual components.
The body represents the distance between open and close. A large green (bullish) body means buyers dominated the session. A large red (bearish) body means sellers dominated. A tiny body — sometimes called a doji — indicates neither side achieved control. The battle was a stalemate.
The upper wick (shadow) represents the highest price reached during the session before sellers pushed it back down. A long upper wick means buyers attempted to push higher but were rejected. This is a sign of selling pressure at that level.
The lower wick represents the lowest price reached before buyers stepped in and pushed it back up. A long lower wick means sellers drove the price down but were overwhelmed by demand. This is a sign of buying pressure at that level.
The wick is often more important than the body. The body tells you who won. The wick tells you where the price was rejected — and rejection zones become the foundation for identifying support and resistance levels that institutional traders monitor.
—
The Five Patterns That Matter Most
There are dozens of named candlestick patterns in trading literature. Most are redundant variations of the same underlying dynamics. Five patterns capture the essential information that experienced traders actually use.
The Hammer and Inverted Hammer. A Hammer appears at the bottom of a downtrend: small body at the top of the candle, long lower wick, minimal upper wick. It tells you that sellers pushed the price significantly lower during the session, but buyers entered aggressively and pushed it back up near the opening price. It suggests potential exhaustion of selling pressure. The Inverted Hammer is the mirror image at the bottom of a downtrend — long upper wick, small body at the bottom — indicating that buyers attempted to rally but were pushed back, though the fact that this occurred after a decline may signal changing sentiment.
The Engulfing pattern. A Bullish Engulfing occurs when a large green candle completely engulfs the body of the previous red candle. It represents a decisive shift in momentum — sellers controlled the previous session, but buyers overwhelmed them in the current session with enough force to exceed the entire previous range. A Bearish Engulfing is the reverse: a large red candle engulfing a previous green candle, signaling sellers have taken control.
The Doji. A candle where the open and close are nearly identical, producing a cross or plus-sign shape. The Doji represents indecision. After a strong trend, a Doji suggests the prevailing side is losing momentum. It is not a reversal signal by itself — it is a warning that the current trend may be weakening.
The Morning Star and Evening Star. These are three-candle patterns. The Morning Star (bullish reversal) consists of a large red candle, followed by a small-bodied candle that gaps down (showing continued selling pressure but diminishing conviction), followed by a large green candle that closes well into the body of the first red candle. The Evening Star is the bearish reverse. These patterns are significant because they document a three-session narrative of trend exhaustion, indecision, and reversal.
The Pin Bar (Shooting Star / Hanging Man). These are single candles with very long wicks relative to their bodies. At resistance, a Shooting Star (long upper wick, small body at bottom) shows that buyers pushed aggressively but were rejected — suggesting the resistance level is holding. At support, a Hanging Man (long lower wick, small body at top) shows sellers tested the level but buyers defended it.
—
Why Context Is Everything: The Location Principle
Here is the critical concept that separates amateur pattern recognition from professional price action analysis: a candlestick pattern’s meaning is entirely dependent on where it appears.
A Hammer at a random point in the middle of a chart is noise. A Hammer at a major support level — a price zone that has historically attracted buyers — is potentially actionable information. The pattern is identical. The location determines its significance.
Professional traders identify key levels before looking for candlestick patterns. These levels include previous swing highs and lows (prices where the market previously reversed), areas of high trading volume (which indicate institutional interest), moving average levels (particularly the 50-day and 200-day), and Fibonacci retracement levels drawn from significant price swings.
When a candlestick pattern appears at one of these pre-identified levels, it has context. The pattern is confirming that the level is generating the kind of buyer or seller response that its history suggests. When a pattern appears at a random, historically insignificant price, it carries minimal predictive value.
This is what experienced traders mean when they say “trade the level, not the pattern.” The level establishes the thesis. The candlestick pattern provides confirmation.
—
Volume: The Missing Verification Layer
A candlestick shows price movement. Volume shows conviction.
A Bullish Engulfing pattern on average volume might represent a minor shift in short-term sentiment. The same Bullish Engulfing on volume that is two or three times the daily average represents significant capital entering the market — institutional-scale buying that is far more likely to sustain a move.
Conversely, a breakout to new highs on declining volume is a warning sign. If prices are making new highs but fewer participants are driving the move, the breakout may lack the underlying demand to sustain itself.
Volume analysis is not infallible, and volume data quality varies by market and instrument. But the principle is consistent: candlestick patterns that are accompanied by unusual volume carry more weight than those that occur on routine activity.
—
Multiple Timeframe Confirmation
A bullish pattern on a 5-minute chart while the daily chart shows a strong downtrend is not a buying opportunity. It is a temporary counter-trend move within a dominant bearish context.
Professional traders use a top-down approach: identify the dominant trend on a higher timeframe (daily or weekly), then look for candlestick patterns on a lower timeframe (4-hour or 1-hour) that align with that dominant trend. Trading with the higher timeframe trend produces consistently better results than trading against it, regardless of how compelling the pattern appears on the lower timeframe.
The framework is straightforward: the higher timeframe establishes direction (bias), the intermediate timeframe identifies key levels, and the lower timeframe provides entry timing through candlestick confirmation at those levels.
—
Risk Management: Where the Actual Edge Lives
No candlestick pattern produces a 100% win rate. Even the highest-probability setups fail regularly. The difference between profitable and unprofitable traders is not pattern accuracy — it is risk management.
Define risk before entry. Before placing any trade, determine the maximum loss you are willing to accept. Place a stop-loss at a price that would invalidate the pattern — for a Hammer at support, the stop goes below the wick of the Hammer. If that level is breached, the thesis is wrong, and the position should be closed.
Apply position sizing. The 1-2% rule limits risk to 1-2% of total account equity per trade. If your account is $10,000, your maximum loss per trade should be $100-$200. This ensures that a losing streak — which is statistically inevitable — does not destroy the account.
Target favorable risk-reward ratios. Professional traders generally require a minimum 1:2 risk-reward ratio — risking $1 to potentially make $2. This means that even a strategy with only 40% accuracy can be profitable, because the winning trades produce twice the value of the losing trades.
Candlestick analysis provides the timing and direction of entries. Risk management determines whether those entries produce long-term profitability. Without disciplined position sizing and stop-loss placement, even the most accurate pattern recognition will eventually result in account depletion.
—
Sources:
1. Investopedia — Candlestick Charts: What They Are and How to Use Them 2. Investopedia — Guide to Candlestick Patterns 3. CMC Markets — Price Action Trading Guide 4. BabyPips — Japanese Candlestick Basics 5. TradingView — Community Education: Candlestick Pattern Recognition 6. Steve Nison — Japanese Candlestick Charting Techniques (2nd Edition), referenced as foundational text 7. Al Brooks — Reading Price Charts Bar by Bar, referenced for institutional price action methodology
Disclaimer: This article is for educational purposes only and does not constitute financial or trading advice. Trading involves substantial risk of loss. Past performance of any strategy does not guarantee future results. The author does not recommend any specific trades or instruments. Consult a licensed financial advisor before trading.